The World IP Organization (WIPO) has recently published its annual report titled: “World Intellectual Property Indicators 2017”, covering world IP filing activity for 2016. The report is a comprehensive coverage of global patent and trademark filing trends, comparing and ranking the world’s leading regional patent and trademark offices (“IP Offices”) by their level of activity in the various categories.
At a high level, it seems like many of the trends observed in 2015 continue into 2016: the global number of filings and grants keeps trending up; China continues to dominate in terms of annual filings and grants (breaking another record of 1.3 million filings this year); and the top 10 filing companies worldwide are all Asia-based multinationals.
Patent Filing Trends
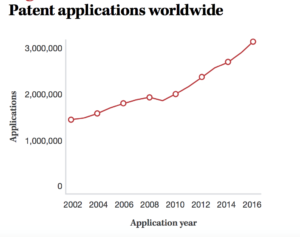
A record number of 3 million patent applications were filed worldwide in 2016, up 8.3% from 2015, as seen in the figure below:

Source: World IP Indicators 2017, WIPO
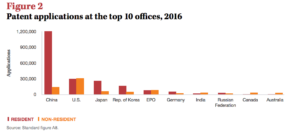
Driving the strong growth in global filings was an exceptional number of filings in China. The State Intellectual Property Office of the People’s Republic of China (SIPO) received 1.3 million patent applications in 2016 – more than the combined total for the United States Patent and Trademark Office (USPTO; 605,571), the Japan Patent Office (JPO; 318,381), the Korean Intellectual Property Office (KIPO; 208,830) and the European Patent Office (EPO; 159,358). Together, these top five offices accounted for 84% of the world total in 2016.
Below is a summary table showing the activity in the top 10 IP Offices in 2016:

Source: World IP Indicators 2017, WIPO
When it comes to understanding China’s continued explosive growth in new patent applications – over 1.3 million filed in 2016, an increase from the 1.1 million in 2015 (the first year the 1 million filings barrier has been exceeded in any country) — the circumstances surrounding the increase in Chinese patent filings are unique and should have come as no surprise to anyone following the Chinese government’s five-year plan of 2011. As explained in an article published in Nov. 2016 in the EE Times by Foresight’s president, Efrat Kasznik, over the last 50 years the Chinese Communist Party implemented a series of five-year plans which guided China’s rapid economic growth. The 2011 five-year plan’s themes of sustainable growth included some specific targets for patent filing per capita. The increased filing activity over the last five years is the direct result of a calculated government effort, enabled by an unprecedented allocation of legislative and administrative resources to support China’s State IP Office. Thus, the sharp rise in Chinese patent filings between 2010 and 2016 is very unique to China’s political circumstances, and is not necessarily correlated with the natural progression of innovation.
When reviewing filing trends by country, one of the most critical observations is the ratio of resident to non-resident filings. A higher ratio of non-resident filings in any given country, is usually an indication not only of the size of that market for the underlying innovations, but also of the strength of the IP enforcement regime in that country. Here, the trends from 2015 are repeating in 2016: as explained by Ms. Kasznik in her article, ratio in China is about 90% resident filers to 10% non-resident filers, a reflection of the relatively weak enforcement regime in China. Conversely, the USPTO and the European Patent Office exhibit a ratio of resident to non-resident filings of about 50/50, attesting to the strength of IP enforcement regimes in those regions.
Patent Grants Trends
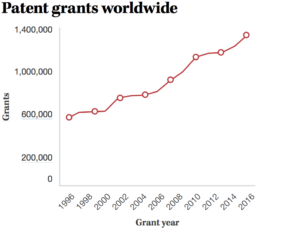
In 2016, an estimated 1.35 million patents were granted worldwide, up 8.9% on 2015.

Source: World IP Indicators 2017, WIPO
SIPO granted 404,208 patents in 2016, followed by the USPTO (303,049), the JPO (203,087), KIPO (108,875) and the EPO (95,956). The top five IP offices issued more than 1.1 million combined, accounting for 83% of the world total.
Not surprisingly, the number of new grants is trending upwards over time along with the number of new filings. The WIPO report also includes statistics related to the operational efficiency of IP offices, such as: the number of examiners, application pendency times, and patent examination outcomes. The workload of IP offices as measured by the number of incoming patent applications has increased over time, but so has their examination capacity to process those applications. The WIPO data show there has been no significant increase in application-to examiner ratios, and for a number of IP offices, growth in numbers of examiners has outstripped the increase in applications.
Another interesting metric reported is the number of patents in force in 2016: the estimated number of patents in force worldwide rose from 7.8 million in 2009 to 11.8 million in 2016. The USPTO leads with 2.8 million patents in force in 2016, followed by the JPO (2 million), SIPO (1.8 million) and KIPO (1 million). These four IP offices account for 63% of all patents in force worldwide.
Filing by Company
The top 10 patent applicants worldwide are Asia-based multinationals: Canon Inc. (Japan) was the top applicant for the period from 2011 to 2014, with 30,476 patent families worldwide, followed by Samsung Electronics (Korea) with 26,609 patent families, and Japanese companies Panasonic (22,899), Toshiba (22,627) and Toyota (22,190). Robert Bosch of Germany (16,582) was the highest-ranking non-Asian company at number 12.
Only 9 countries of origin comprise the top 100 list of applicant companies for the period from 2011 to 2014: Japan (40), China (26), Korea (15), U.S. (9), Germany (6) and one each from France, the Netherlands, Sweden and Taiwan.

